
Last updated: 25 September 2026
Statistical analysis involves applying mathematical and statistical methods to research data to summarize it, test relationships or differences, evaluate hypotheses, and produce findings that can be defended to a supervisor, review committee or journal reviewer — rather than conclusions based on visual impression alone. A statistical analysis service typically supports a researcher through this process, from a raw dataset to a reported, interpreted result.
Data cleaning and preparation
Statistical method selection
Descriptive analysis
Inferential analysis
Hypothesis testing
Assumption checking
Statistical interpretation
SPSS/R/Python analysis
Tables and charts
Most statistical analysis problems researchers bring to us are not really software problems. A scholar rarely struggles because SPSS is hard to click through — they struggle because nobody has clearly connected their research question to a specific analytical method, and nobody has explained why that method fits their data.
Our approach follows the same logic every serious quantitative study should follow:
Software is where this chain is executed — not where it begins. A test chosen without reference to the research design can be technically "run" correctly and still be the wrong test. That distinction is the core of how we work.
Checking for missing values, identifying outliers, screening for duplicate or inconsistent entries, coding categorical variables, labelling variables and values, and organizing the file so the structure matches the analysis plan. Weak preparation is one of the most common reasons an otherwise sound analysis produces confusing results later.
Frequencies, percentages, measures of central tendency (mean, median, mode), measures of spread (standard deviation, variance, range, quartiles), and distribution summaries that give a first honest picture of the dataset before any hypothesis is tested.
Hypothesis testing, confidence intervals and significance testing using parametric or non-parametric approaches, selected according to variable type, distribution and sample size rather than by default.
Framing null and alternative hypotheses correctly for the chosen design, selecting a test that matches the data, and reporting the result — test statistic, degrees of freedom, p-value and effect size where relevant — in the format your department or target journal expects.
Linear regression, multiple regression and logistic regression for studies examining how one or more variables predict or relate to an outcome, continuous or binary.
Pearson correlation for linear relationships between continuous variables, Spearman correlation for monotonic or ordinal relationships, and cross-tabulation with chi-square testing for associations between categorical variables.
Independent-samples and paired-samples t-tests, one-way and repeated-measures ANOVA, MANOVA and ANCOVA for comparing groups or conditions, alongside non-parametric alternatives (Mann-Whitney U, Wilcoxon signed-rank, Kruskal-Wallis, Friedman) when parametric assumptions aren't met.
Factor analysis and PCA for dimension reduction, cluster analysis for grouping cases, mediation and moderation analysis for indirect and conditional effects, and — where the design genuinely calls for it — multivariate techniques, longitudinal/time-series analysis, survival analysis, and SEM/PLS-SEM. Offered where the research design supports them, not applied by default to every project.
Share your research context — objectives, variables and design — and we'll help you think through the analytical requirement before committing to a method.
Statistical analysis is the process of applying mathematical methods to collected data in order to summarize it, test relationships or differences, and draw conclusions that are supported by evidence rather than assumption. In a PhD, thesis or journal context, it is what turns a raw dataset into a finding that can be defended.
Statistical analysis matters in research because it lets a researcher move from "I collected data" to "here is what the data actually shows." It helps evaluate hypotheses against evidence, uncovers patterns and relationships that aren't obvious from raw numbers, and quantifies how much uncertainty surrounds a conclusion rather than pretending there is none.
A few points get lost on many research pages, so we say them plainly:
A test that ignores the measurement scale or violates its own assumptions can produce a number that looks precise and means very little.
A p-value tells you how likely a result is under the null hypothesis — it does not, by itself, tell you whether the effect is meaningful in practice.
Give scale and precision to a result that a p-value cannot provide on its own, and reviewers increasingly expect to see them reported.
Normality, independence, homoscedasticity and similar conditions vary by method, and violating them changes how much you can trust the output.
A correlation is not evidence of causation; a cross-sectional design cannot support a longitudinal claim, however the numbers come out.

Statistical analysis doesn't sit apart from research methodology — it's one link in a chain that starts well before any software is opened:
Each stage constrains the one after it. How you defined your variables affects which statistical tests are even valid. How you sampled affects what your results can be generalized to. This is why we review the methodology chapter (or draft methodology) alongside the dataset rather than treating the dataset as a standalone file.
It's also worth being precise about scope: statistical analysis is primarily associated with quantitative data. Purely qualitative research — thematic analysis, grounded theory, narrative inquiry — is not something statistical testing is appropriate for. Many mixed-methods studies, however, genuinely combine both: a quantitative strand analyzed statistically alongside a qualitative strand analyzed thematically, brought together in the discussion. We support the quantitative strand of mixed-methods work; we don't claim statistical analysis is a substitute for qualitative interpretation.
The same variable can call for a different analysis depending on how the study is designed:
Data collected at one point in time — typically support descriptive statistics, correlation, group comparison and regression, but not claims about change over time.
Repeated measures on the same subjects — often call for repeated-measures ANOVA, mixed models, or time-series methods that account for within-subject correlation.
Manipulated conditions and random assignment support causal-style comparisons (t-tests, ANOVA, ANCOVA) that observational data cannot support as strongly.
Lacking random assignment, need the same comparison tests used more cautiously, often alongside checks for confounding.
Commonly rely on descriptive statistics, cross-tabulation, correlation and regression to describe relationships without implying causation.
Built around, respectively, group-difference tests and association measures — different tools for different questions.
Knowing which category your study falls into is often the single biggest factor in choosing the right method — more important than which software you plan to use.
The right test depends on your research objective, the type and measurement scale of your variables, how many groups you're comparing, your sample size, and whether your data meets the assumptions of a parametric test.
| Research Need | Common Statistical Approach |
|---|---|
| Summarize a dataset | Descriptive statistics |
| Compare two independent groups | Independent-samples t-test / Mann-Whitney U |
| Compare paired observations | Paired t-test / Wilcoxon signed-rank |
| Compare three or more groups | ANOVA / Kruskal-Wallis |
| Examine association between categorical variables | Chi-square test |
| Measure linear association | Pearson correlation |
| Measure monotonic/ordinal association | Spearman correlation |
| Predict a continuous outcome | Linear or multiple regression |
| Predict a binary outcome | Logistic regression |
| Explore latent dimensions | Factor analysis |
| Reduce dimensionality | Principal Component Analysis (PCA) |
| Test an indirect effect | Mediation analysis |
| Test a conditional relationship | Moderation analysis |
| Compare groups on several outcomes at once | MANOVA |
| Compare groups while controlling for a covariate | ANCOVA |
Software is a means of implementing an appropriate analytical method — not a substitute for research design. We work primarily across three tools, chosen according to what your department, journal or research design requires.
IBM SPSS Statistics remains the most widely used tool in social science, management, education and health-research departments because of its menu-driven interface and familiar output tables. We use it for everything from descriptive statistics through regression, ANOVA, factor analysis and non-parametric testing.
R suits studies that need more flexibility — custom visualizations, less common models, reproducible scripts, or techniques not well supported by menu-driven software. We can deliver annotated R scripts alongside output so your analysis is transparent and re-runnable.
Python is a good fit for research that overlaps with data science — larger datasets, machine-learning-adjacent methods, or analysis that needs to sit alongside an implementation/coding component of your project. Output can be delivered as commented scripts or notebooks.
Where a project genuinely calls for it, we also work with the following:
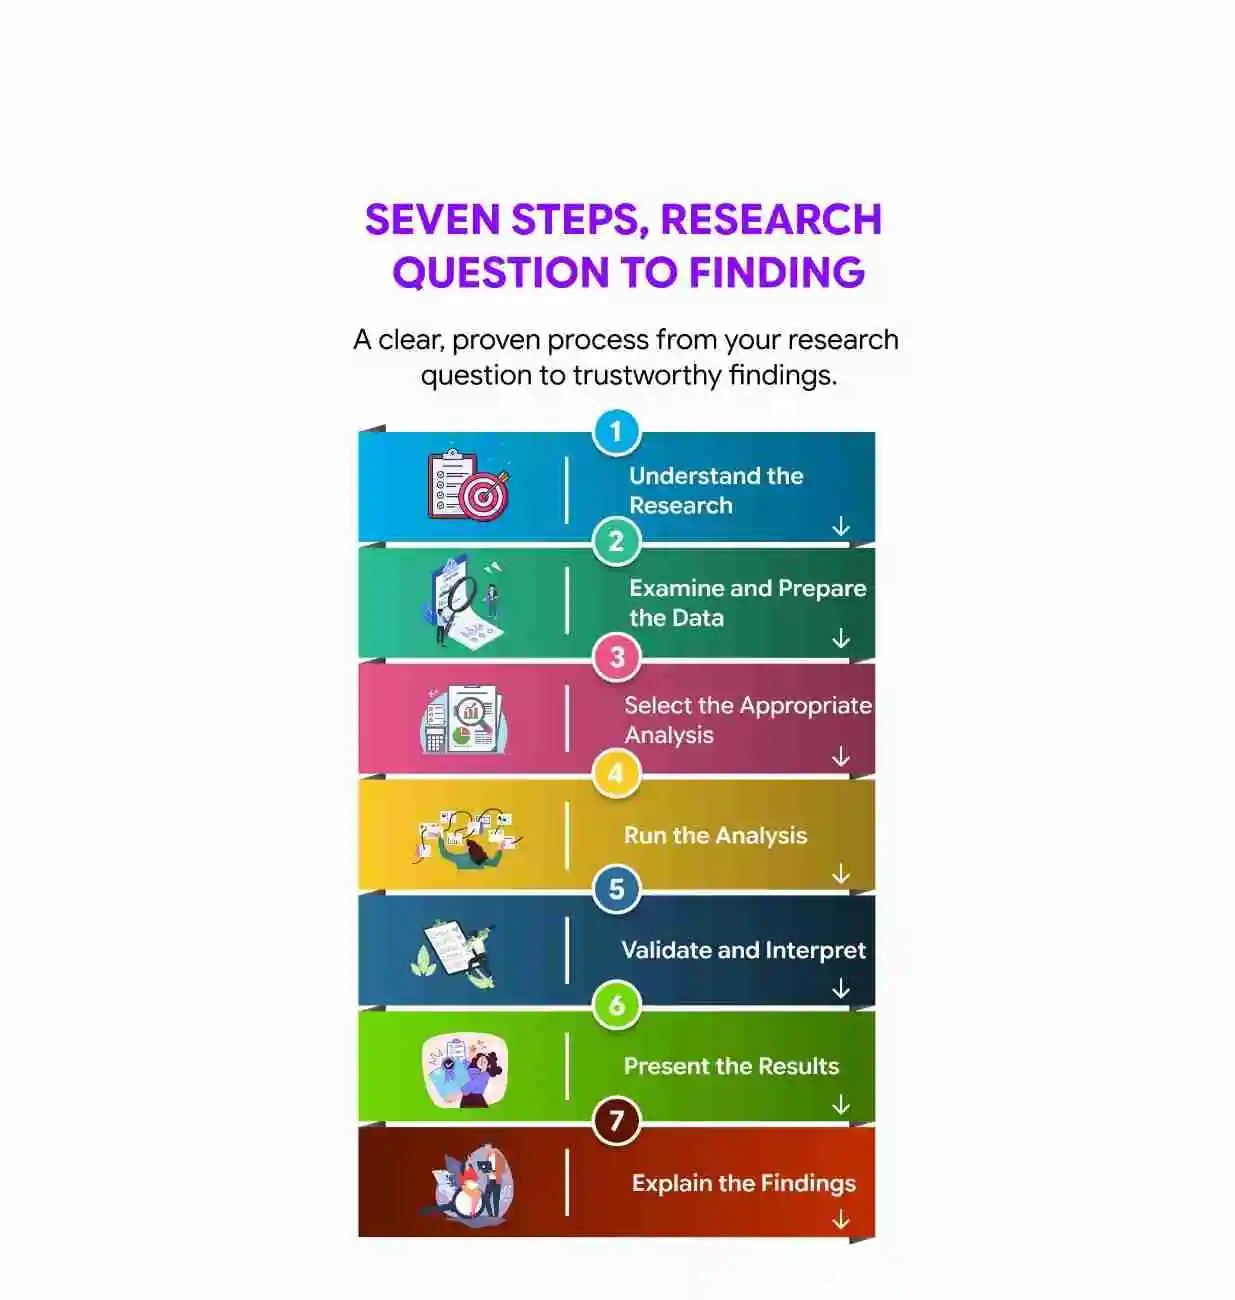
We review your objectives, hypotheses, research questions, methodology chapter and dataset before touching any software.
Cleaning, coding, screening for missing values and outliers, and organizing the dataset for analysis.
Method selection based on your research design, variable types and the assumptions those methods require — explained, not just decided for you.
Execution in SPSS, R or Python, matched to your requirement and, where relevant, your department's expectations.
Checking assumptions, reviewing statistical significance, effect sizes and diagnostics before accepting an output at face value.
Research-ready tables, charts and statistical summaries formatted for a thesis chapter or manuscript.
Connecting the statistical output back to your research objectives and hypotheses, without overstating what the numbers support.
You do not need to know the correct statistical test before contacting us. If you are unsure about the method, share the research context and we can assess the analytical requirement within the agreed scope.
If you have only the research proposal or methodology and have not collected data yet, that context can still be useful for discussing the statistical-analysis plan.
Not every researcher needs a complete end-to-end analysis. The right level of support depends on where you are in the research process.
You can discuss your research requirements first rather than deciding in advance which package or test you need.
Implementing the data we have is very important. We have experts who can guide you in implementing the idea in your mind. Explore our other implementation services where our professional experts can guide you.
Explore Our Implementation Services →Different stages of academic work need different kinds of support:
From proposal-stage test selection through to full results-chapter analysis.
Scoped support matched to a shorter timeline and a defined dataset.
Analysis aligned to your university's expected chapter structure and reporting conventions.
Statistical sections written to match the reporting standards of your target journal.
From questionnaire data cleaning and reliability checks through to full inferential analysis.
Group-comparison and pre/post analysis aligned to your experimental design.
Descriptive and inferential analysis for clinical and public-health datasets, within the limits of what a statistical-support service (not a clinical authority) can appropriately provide.
Survey-based and behavioural data analysis, including reliability, factor analysis and regression-based models.
Statistical analysis supporting experimental or simulation-based results, alongside our implementation support for the coding side of a project.
A correct analysis can still fail to communicate if it isn't reported properly. We help present findings as:
We report results accurately and avoid implying causation where a design only supports association, and avoid presenting a single p-value as a complete finding.
Significance has to be read alongside effect size and confidence intervals to mean something in practice.
Interpretation stays tied to what the research design can actually support.
This step is where a lot of otherwise-sound analyses go wrong, and it's a step competitor pages rarely explain. Depending on the method, we check for:
Whether a variable's distribution meets a parametric test's requirements.
Whether observations are genuinely independent of each other.
Equal variance across groups or across a regression's predicted values.
Overlapping predictors in a regression model.
Whether a relationship is actually linear before applying a linear method.
Data points that can distort an estimate disproportionately.
How much is missing, and whether it's missing at random.
Where relevant — e.g., internal consistency of a scale.
For regression, factor analysis and SEM-type models.
Depending on your project scope, deliverables can include:
A cleaned and coded dataset
Statistical analysis output (SPSS files, R scripts, or Python scripts/notebooks, as applicable)
Statistical tables, charts and graphs
Descriptive and inferential statistics
Hypothesis-testing and model output
Written interpretation notes connecting results to your objectives
A statistical analysis report, or results-chapter support for a thesis/dissertation
Methodology-related recommendations where your approach needs justification
Exact deliverables are agreed at the scoping stage and depend on what your project actually requires.

Share your requirements and get expert guidance.
Consider a hypothetical survey study examining whether employee training, job satisfaction and organizational support are associated with employee performance. A research-aligned analysis might progress as follows:
Do training, job satisfaction and organizational support relate to employee performance?
The outcome variable is employee performance, while training, job satisfaction and organizational support are predictor variables.
Questionnaire responses are coded, missing values are reviewed, and the dataset is screened for relevant data-quality issues.
If multi-item scales are used, reliability and other appropriate measurement checks may be performed.
Frequencies, percentages, means and standard deviations provide the descriptive picture.
Correlation analysis may be used to examine relationships between variables where appropriate.
Multiple regression may be considered if the research question and design support examining the contribution of several predictors to a continuous outcome.
Relevant assumptions and diagnostics are reviewed before interpreting the model.
The findings are presented in tables and explained in relation to the study objectives and hypotheses without claiming more than the design supports.
There is no reliable single turnaround time for every statistical analysis project. The timeframe depends on factors such as:
Dataset size and structure
Number of variables
Number of research objectives and hypotheses
Data-cleaning requirements
Number and complexity of statistical procedures
Reliability or validity analysis requirements
Advanced modeling requirements
Amount of interpretation and reporting needed
University or journal formatting requirements
A clearer timeline can be provided after the research requirements and dataset, where available, have been reviewed.
Statistical analysis requirements vary substantially from one research project to another. A project involving basic descriptive statistics and a few hypothesis tests is different from one requiring data cleaning, reliability analysis, regression, mediation, advanced modeling and a complete results report. For that reason, pricing should be based on the agreed scope rather than a generic one-size-fits-all package.
Dataset complexity
Number of variables
Number of analyses
Data-preparation requirements
Advanced statistical methods
Interpretation requirements
Reporting or results-chapter support
Turnaround requirements
We start with your research question and methodology, not with "which test do you want run."
SPSS, R and Python are all supported, so the tool matches your requirement rather than the other way round.
Every analysis comes with interpretation you can defend in a viva or to a reviewer — not just an output file.
Your data and research are handled privately throughout.
You know upfront what's included before work begins.
From early methodology questions through to results-chapter support, alongside Zonduo's wider PhD research services.
We don't quote fabricated statistics about "how many" scholars or papers to make this point — you're welcome to discuss our process and see examples of the kind of output you'd receive before committing.
Research datasets may contain unpublished findings, questionnaire responses, proprietary information or other sensitive research material. Statistical-analysis support should therefore be handled with appropriate care. Zonduo's service approach emphasizes:
Confidential handling of research information.
Clear agreement on the scope of analysis.
Limiting analysis to the requirements agreed for the project.
Avoiding unnecessary disclosure of research data.
Appropriate anonymization when examples are used publicly.
Transparent communication about what has and has not been analyzed.
Statistical analysis support should strengthen a researcher's own understanding and presentation of their work — not replace their judgment or misrepresent their data. In every engagement, we work within these boundaries:
Transparency about the methods used and why.
Reproducibility of the analysis where practically possible.
Accurate reporting of results, including results that don't confirm a hypothesis.
No fabrication or manipulation of data or output.
No selective reporting designed to mislead a reader.
Compliance with your university's or journal's academic-integrity policies.
We do not guarantee journal acceptance, publication outcomes, or that a hypothesis will be statistically confirmed — no legitimate statistical service can promise that.
Likert Scale in Research: Types, Examples & Analysis
A Likert scale is a research instrument made up of several ordered response items — usually ranging from "strongly disagree" to "strongly agree" — combined into a single score to measure an attitude, opinion, or perception that can't be observed directly.
Statistical analysis in research is the use of mathematical methods to summarize data, test relationships between variables, and evaluate hypotheses with a known level of uncertainty, rather than relying on visual impression alone.
It lets researchers move from raw data to defensible conclusions — evaluating whether an observed pattern is likely to reflect a real effect, and how confident they can be in that conclusion.
Typically data cleaning and preparation, method selection, running the analysis in software such as SPSS, R or Python, checking assumptions, and interpreting and presenting the results. Exact scope depends on the project.
It depends on your research objective, variable types, measurement scale, number of groups and sample size. We review your specific study before recommending a method rather than giving a generic answer.
Yes. SPSS is one of our core supported tools, covering descriptive statistics through regression, ANOVA, factor analysis and non-parametric testing.
Yes, including annotated, re-runnable R scripts for studies that need more flexibility than menu-driven software offers.
Yes, delivered as commented scripts or notebooks, particularly useful where your project also involves a data-science or implementation component.
Yes — from questionnaire coding and reliability checks (e.g., Cronbach's alpha) through to descriptive and inferential analysis of survey responses.
Yes. Data cleaning, coding, missing-value assessment and outlier screening are usually the first step, before any test is selected.
Yes. We explain what each table and statistic in your output actually means in relation to your hypotheses, in plain language you can use in your write-up.
Yes, from proposal-stage method selection through to full results-chapter support.


